Why QInsights Doesn't Offer "Instant AI Analysis" – And What We Do Instead
Dec 29, 2025

While searching for the right tool for you research, you might have also come across AI-powered research tools that provide impressive promises:
"Our app is built to expand research while preserving qualitative depth, quantitative scope, and efficiency. It enables researchers to take on more projects and deliver them faster, without compromising accuracy."
"Our app conducts interviews, analyses responses, and delivers actionable insights in hours, not weeks."
Charts showing frequencies percentages of respondents mentioning each theme. Export-ready tables. One-click significance testing.
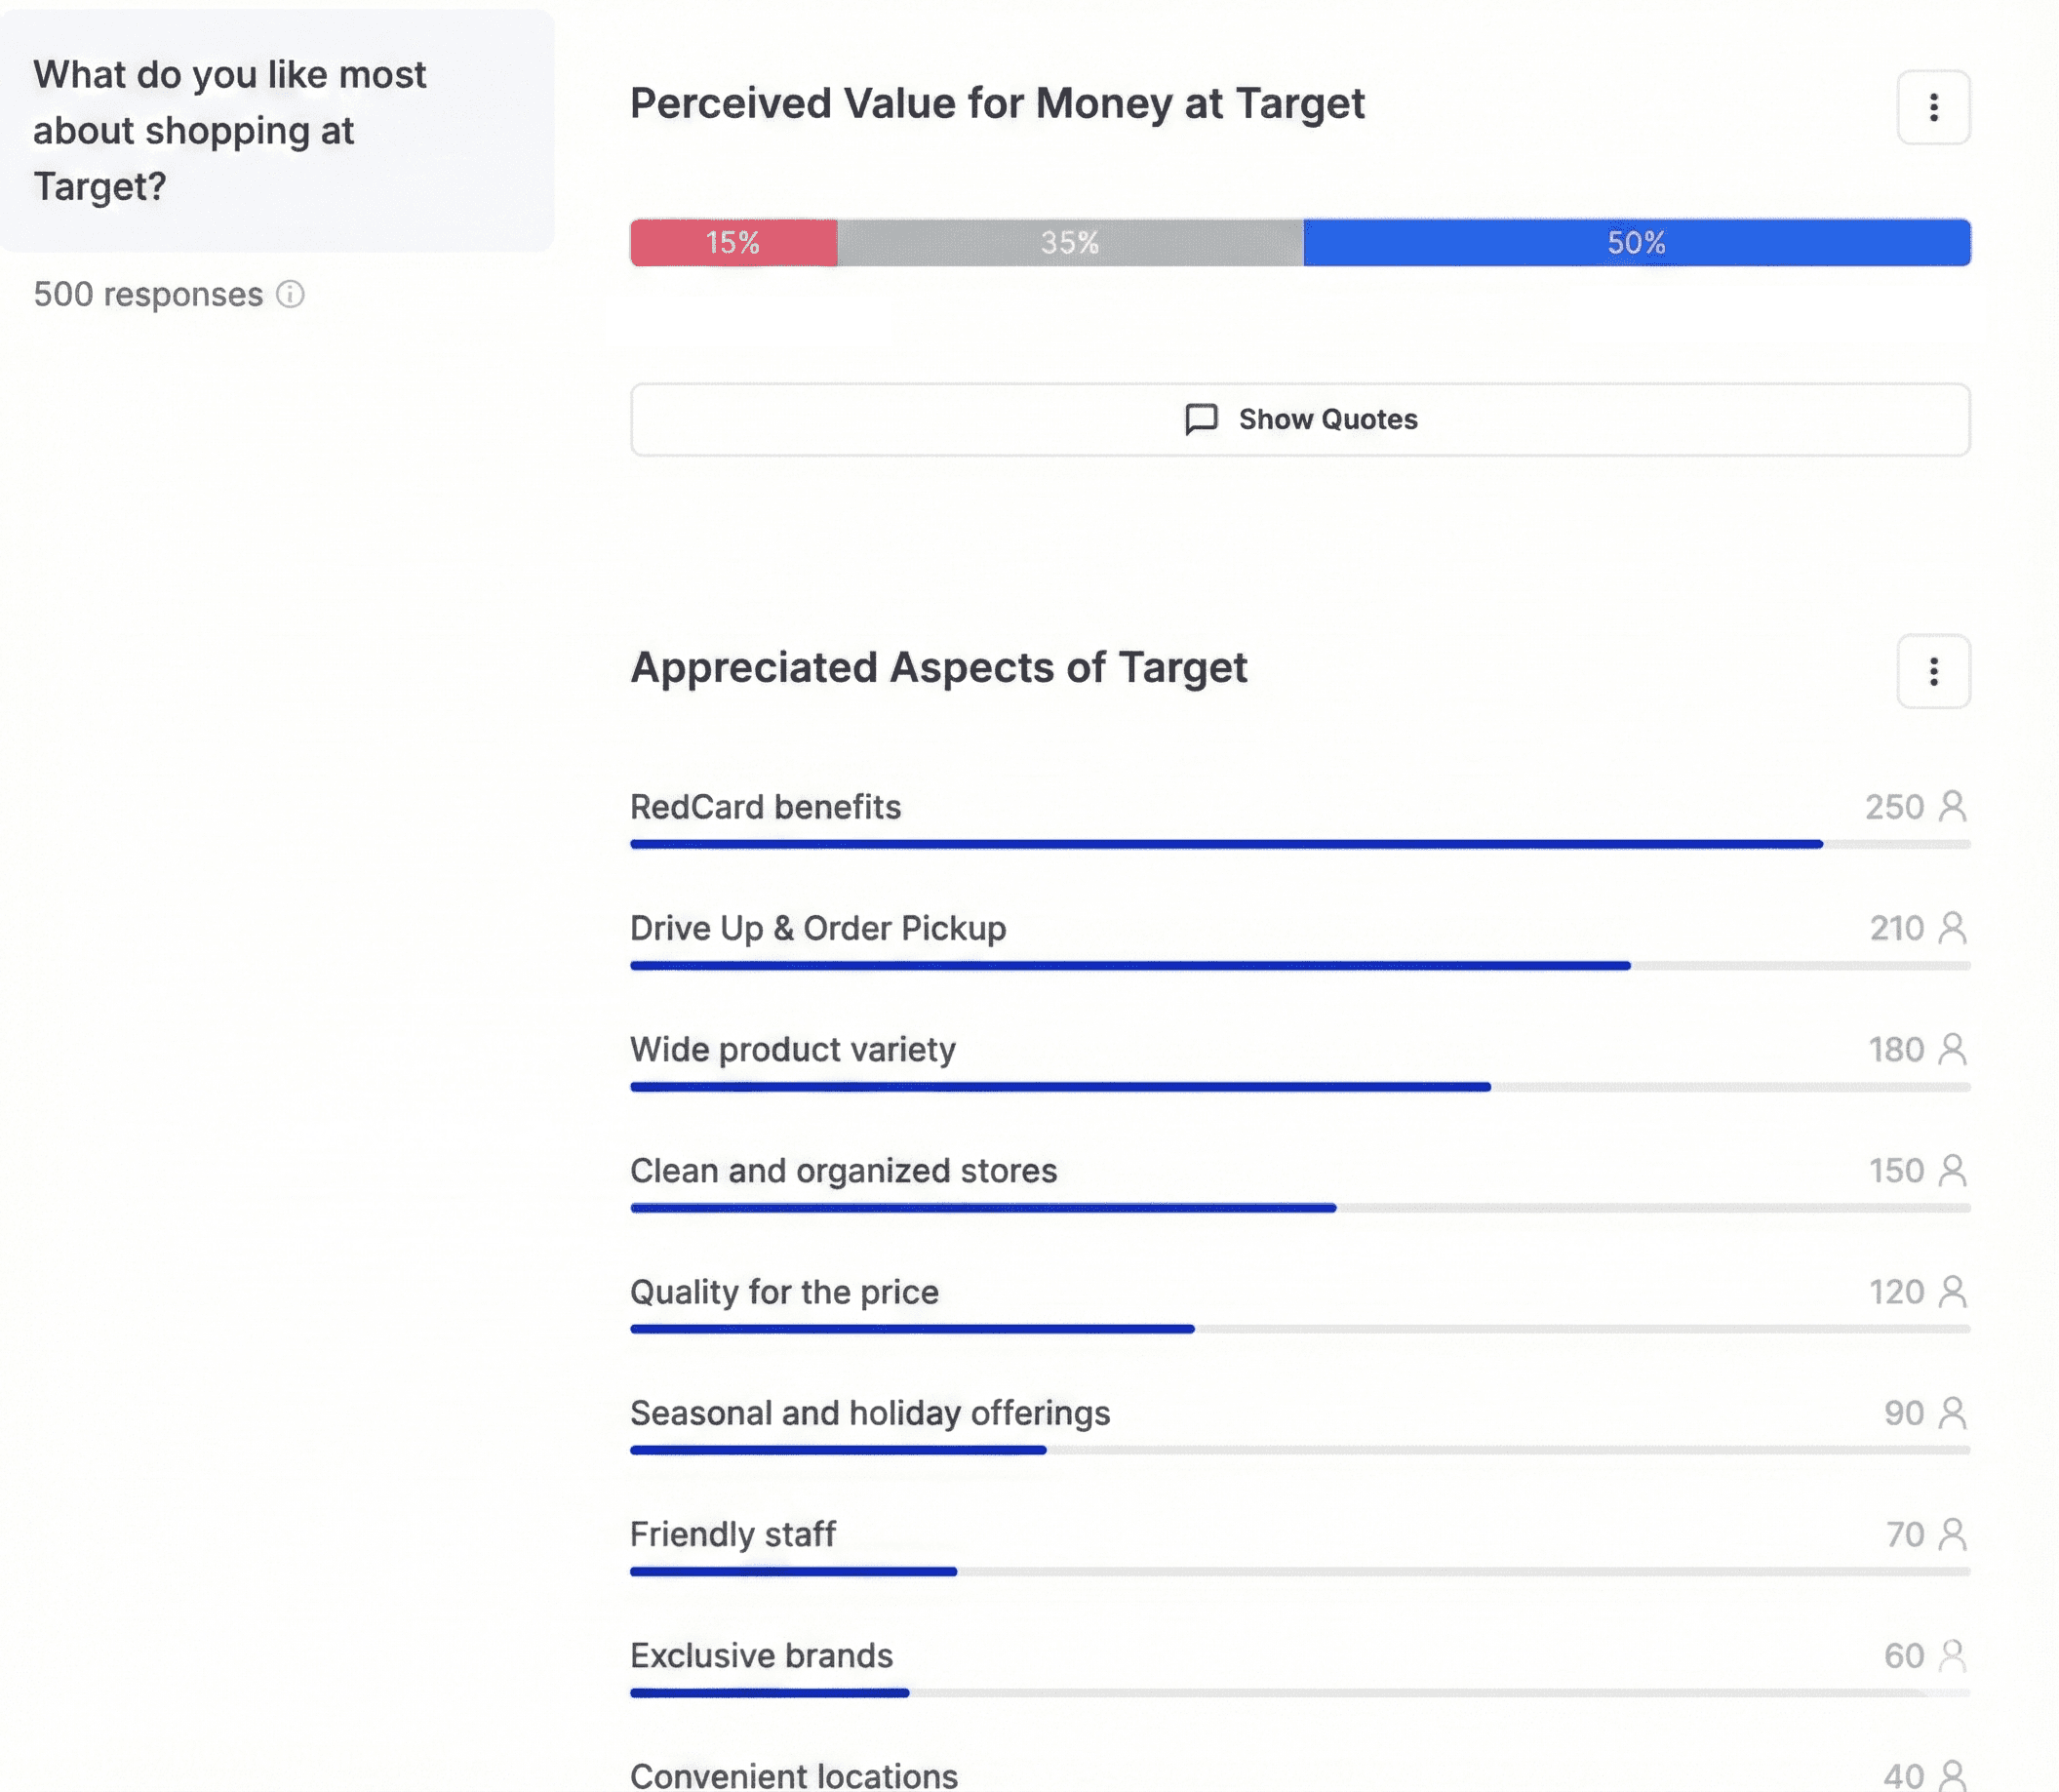
Figure 1: Mock-up of how AI categorisation could look like
It looks professional. It looks scientific. And if you're pressed for time or overwhelmed by hundreds of open-ended responses, it looks like exactly what you need.
We understand the appeal. Starting from a methodological perspective, it was clear to us that we won't build a tool like that.
This blog post explains what these "instant analysis" features actually do, why they create more problems than they solve, and what QInsights offers instead—an approach that scales without sacrificing integrity.
The Seductive Promise: What These Tools Offer
Let's be clear about what's being marketed. Many AI-powered research platforms now promise some version of the following:
1. Automatic Theme Extraction
Upload your transcripts or survey responses, and the AI identifies recurring themes across your data. You get a neat list: "Customer Service Issues," "Product Quality Concerns," "Pricing Sensitivity."
2. Instant Categorization with Percentages
The tool assigns each response to one or more themes and gives you quantified results: "47% of respondents mentioned price," "23% expressed dissatisfaction with support."
3. Sentiment Scoring
Some tools add an additional sentiment scoring. This means response gets rated: positive, negative, neutral including numerical sentiment scores that can be averaged and compared.
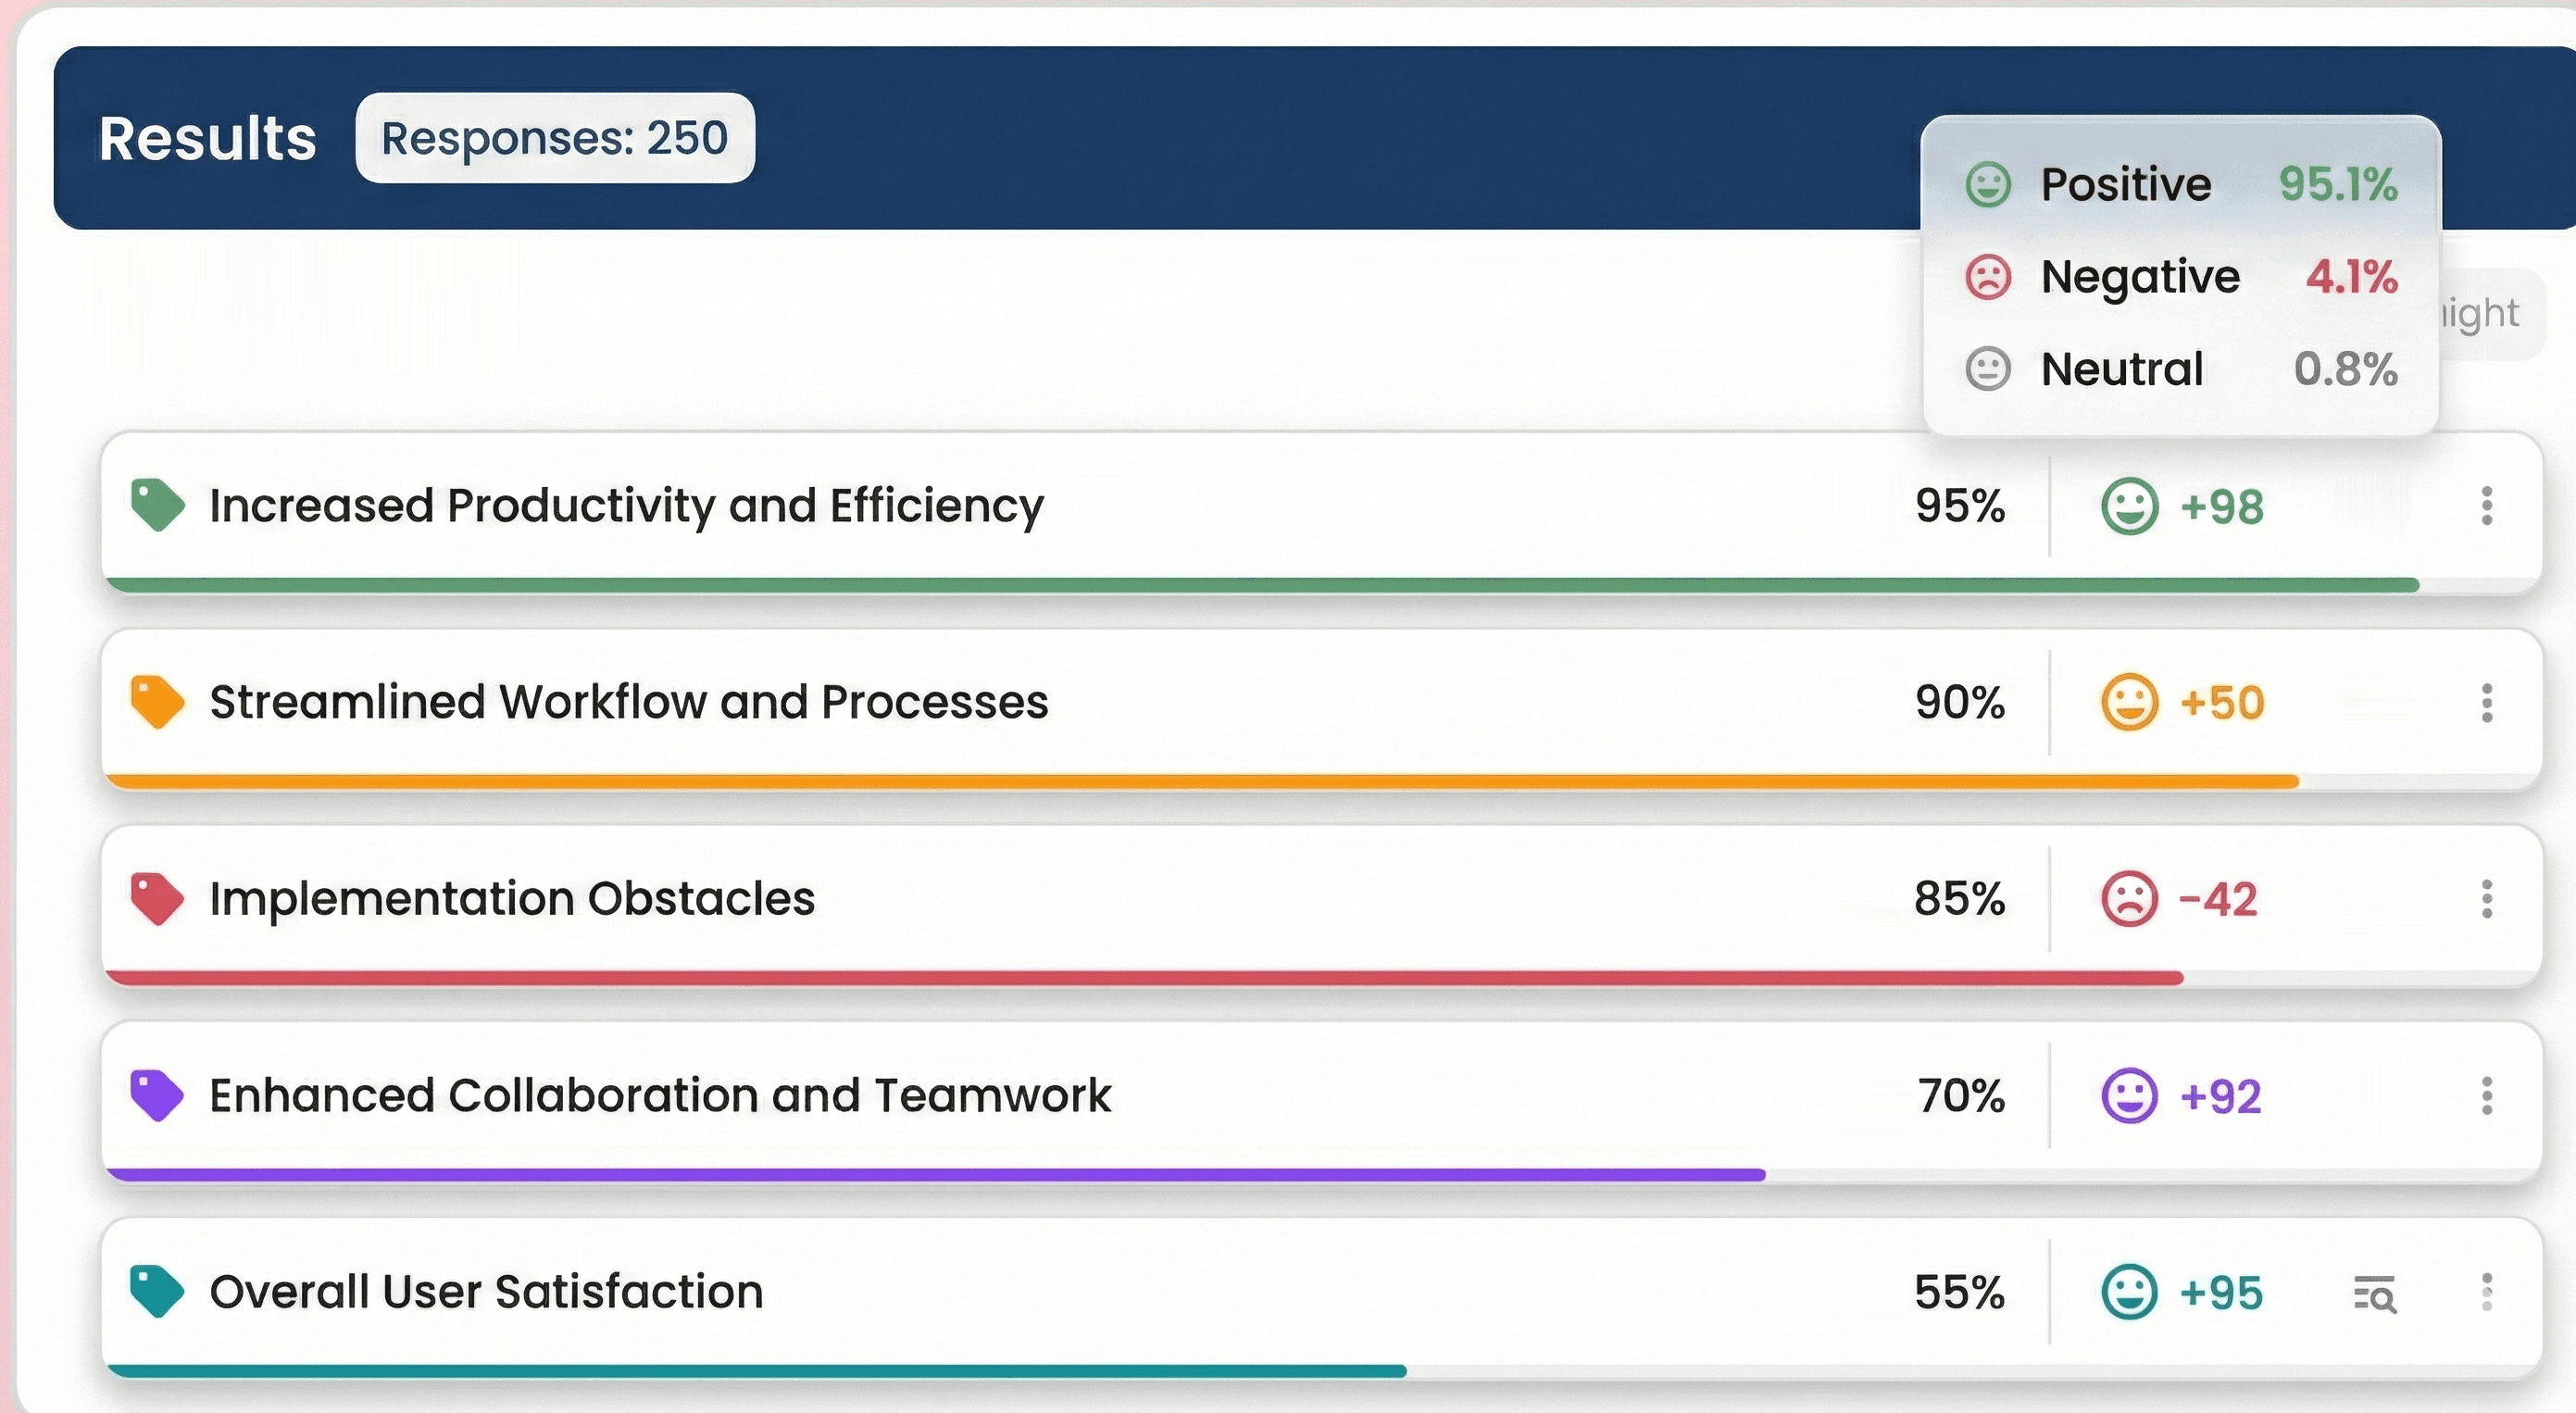
Figure 2: Mock-up of how AI generated categories with sentiment scoring could look like
4. Statistical Analysis
What we also see from time to time is that those categorized data flow directly into cross-tabulations, chi-square tests, ANOVAs. You can compare how different demographic groups scored on sentiment or which themes appeared more frequently among certain customer segments.
5. Export to Statistical Software
Everything outputs to SPSS, Excel, or your analytics platform of choice, ready for "rigorous" statistical testing.
If you don't know much about how AI actually works, this looks like a dream come true. Fast, scalable, objective, and scientific.
Why This Doesn't Work: The Methodological Reality
Here's what these tools are actually doing—and why the promises fall apart under scrutiny.
The Core Problem: AI Classification Isn't Measurement
When an AI "categorizes" your data, it's not discovering objective facts. It's making probabilistic interpretive judgments based on pattern matching in its training data.
Think about what this means:
The AI doesn't "understand" your data. It's predicting which words and phrases typically cluster together based on billions of text examples it's seen before. Every categorization is a probability distribution, not a fact. A response might be 60% likely to fit "customer service" and 40% likely to fit "product quality"—but the tool shows you only the top choice.
These probabilities shift slightly every time you run the analysis (unless the system uses extremely restrictive settings that introduce their own problems). The result? Those percentages you're looking at—"47% mentioned price"—aren't frequencies of objectively measured phenomena. They're outputs from a probabilistic system making judgment calls that could differ on the next run.
If you want to learn a bit more about the technical details behind it, here is an explanation why restrictive settings are problematic:
When AI systems use very low temperature settings (close to 0) to make outputs more consistent, i.e. reproducible, they become more deterministic - which sounds good for reliability. BUT this introduces different problems:
Loses nuance - The model always picks the single "most likely" classification, even when responses are genuinely ambiguous or could reasonably fit multiple categories
Suppresses uncertainty - Hides cases where the AI is actually uncertain (maybe it's 51% confident in one category vs 49% in another - but you'd never know)
Can increase brittleness - Small changes in wording can flip classifications dramatically because the system isn't considering the full probability distribution
Still not perfectly reproducible - Even at temperature 0, there can be minor variations across different systems or API versions
The Scale Problem: Instability Compounds
With 50 responses, minor inconsistencies might not matter much. But consider what happens at scale:
With 500 responses and 2% classification variance, that's 10 responses coded differently on reruns
With 1,000 responses, you're looking at 20+ responses potentially shifting between categories
These aren't random errors—they're systematic differences in how the AI interprets ambiguous or context-dependent language. When you run statistical tests on these numbers, you're treating them as stable measurements. But they're not. You're building your analysis on shifting sand.
The Sentiment Scoring Illusion
Sentiment analysis is particularly problematic because it strips away context:
Sarcasm reads as positive: "Oh great, another software update that broke everything" scores positive because of "great."
Qualified criticism disappears: "The product is good, but the support is terrible" might average to neutral.
Cultural and linguistic nuance vanishes: Different communities express dissatisfaction in radically different ways.
Aggregating these scores and comparing them across groups creates the appearance of measurement precision that simply doesn't exist.
The Statistical Analysis Trap
This is where things get truly problematic. When you export AI-generated categories to SPSS and run ANOVAs or chi-squares, you're making multiple implicit claims:
Claim 1: These categories are stable, valid constructs that can be treated as variables.
But they're not. They're:
Interpretive classifications made by an algorithm
Subject to the inconsistencies described above
Not validated against any ground truth
Not subjected to inter-rater reliability testing
Claim 2: Your sample supports statistical inference.
But consider:
Were respondents randomly sampled from a defined population?
Do you know the sampling distribution?
Are you trying to generalize beyond your data, or just describe it?
Most open-ended survey data or AI intervies comes from convenience samples, self-selected participants, or specific customer segments—not probability samples. Running ANOVAs or chi-squares on such data and interpreting p-values as if they indicate population-level differences is statistically inappropriate, regardless of how the data was coded.
Thus, on top there are compounding problems:
Unstable AI classifications (measurement validity issue)
Being treated as stable variables (reification problem)
Statistical tests run on non-probability samples (inference validity issue)
Results presented as if they're generalizable findings (interpretation problem)
Running significance tests under these conditions is methodologically indefensible—but it looks rigorous enough that many people don't question it.
The "Better Than Nothing" Counterargument
Defenders of these tools might argue: "Sure, it's not perfect—but human coding isn't perfectly reliable either. And with hundreds of responses, researchers would either cherry-pick quotes or not analyze systematically at all. This is better than the alternative."
There's a grain of truth here. Human coding does have reliability challenges. And yes, automation makes certain types of pattern-spotting possible at scale. But here's the crucial difference:
When human researchers code data, they:
Can make their decision rules explicit
Can track and report inter-coder reliability
Can revise and refine categories as they work through data
Remain accountable for their interpretive choices
When an AI tool auto-categorizes and presents percentages, it:
Obscures its decision-making process
Rarely reports consistency metrics
Presents provisional outputs as finished analysis
Creates the illusion of objectivity without the transparency
You might wonder: "Surely experienced researchers would spot these problems?" Not necessarily. And it's not because they're naive—it's because AI literacy is a new required competency that many seasoned researchers don't yet have. When a tool company says "Our AI extracts themes and calculates sentiment," researchers without AI literacy might assume:
The AI "understands" the content → It doesn't; it's identifying statistical patterns in language
Themes are "discovered" like a researcher would discover them → They're algorithmically generated through clustering and pattern matching, not interpretive reading
The results are reproducible and stable → They're probabilistic and can vary between runs
If professors are using it, it must be valid → Adoption ≠ validation
It's a gap between how AI is marketed and what it actually does.
When Automated Text Analysis Makes Sense: NLP for Big Data
It's important to distinguish between problematic uses of AI in research and legitimate applications of natural language processing (NLP) for large-scale text data. These serve fundamentally different purposes and make different epistemological claims.
The Big Data Context
When organizations collect thousands of customer reviews, support tickets, or feedback forms daily, they face a genuine operational challenge: no human team can read and manually analyse that volume of text. This is where traditional NLP and machine learning approaches are appropriate—not as qualitative research methods, but as text mining and pattern detection tools.
What NLP Does (and Doesn't) Claim to Do
Traditional NLP categorization for large datasets serves operational monitoring needs. It can track trends over time, such as detecting that mentions of shipping delays increased 15% this month. It identifies urgent issues for triage, like flagging complaints about safety concerns. It detects emerging topics across massive text corpora and provides descriptive overviews of what topics appear and how frequently.
What NLP delivers is pattern detection at scale, automated sorting and routing, quantitative summaries of topic prevalence, and alerts when certain patterns spike or drop. What it explicitly does not claim is deep understanding of meaning or context, interpretive insight into why people say what they say, theoretical or conceptual development, or the kind of analytical depth expected from qualitative research.
The Critical Distinction
The key difference lies in transparency about purpose and limitations. When using NLP for operational text processing, appropriate claims sound like "Our algorithm detected that 23% of reviews mention shipping." The goal is efficient monitoring, not interpretation. Users expect quick patterns, not deep insight. The methodology involves pattern matching, classification, and clustering.
The Epistemological Difference
NLP for big data operates in a detection paradigm. It answers questions about what topics are present, what patterns appear, what frequencies we observe, and what's changing over time. These are descriptive questions about the surface of the text.
Qualitative research operates in an interpretive paradigm. It explores what things mean to participants, how concepts relate to each other, what the significance of patterns might be, and what theoretical insights can be generated. These are analytical questions that require sustained engagement with the data's depth and context.
Both are valuable. Both serve important purposes. But they are not interchangeable, and one cannot simply replace the other by adding "AI-powered" to the label.
The Bottom Line
Using NLP to categorize 10,000 customer reviews for operational monitoring is legitimate and practical. The scale makes human analysis impractical, and the purpose is appropriately scoped to pattern detection rather than deep interpretation. Using LLMs to auto-code 50 interview transcripts and calling it "qualitative analysis" is methodologically problematic. This becomes even more troubling when those AI-generated codes are then subjected to statistical significance testing as if they were validated measurement constructs derived from a probability sample.
The issue isn't the technology itself. It's the claims made about what the technology delivers, and whether users understand the difference between automated pattern detection and interpretive analysis. When tools blur these boundaries, users lose the ability to make informed methodological choices about what approach suits their research questions and epistemological commitments.
A Sound Approach to Analysing Data with GenAI
So, if instant AI categorization is methodologically problematic, what should researchers do with large volumes open-ended responses or interview transcripts? This is the question we've been grappling with at QInsights—and we think there's a better path forward. The analytical goal should be: structured sensemaking, not measurement. This framing alone changes everything.
Shift from "Classification" to "Pattern Surfacing" Instead of asking: "Which code does this answer belong to?"
Ask: "What patterns are present across answers, and how are they expressed?"
That's a crucial methodological shift. You're not trying to sort responses into predetermined boxes—you're trying to surface what's actually there and understand variation.
Step 1: AI Does Semantic Clustering (Not Coding)
The first step leverages what AI genuinely does well: identifying patterns across large volumes of text. When you run a theme analysis in QInsights, the AI groups responses by semantic similarity, detects recurring motifs and framings, and surfaces concerns that appear across your data. This works whether you're analyzing hundreds of open-ended survey responses or dozens of interview transcripts.
But here's the crucial distinction: These are provisional groupings, not codes. Currently, we still call them "themes". We might change this in a future update to something like response clusters, semantic groups, or pattern candidates. It is actually more appropriate.
We make explicit that: "Theme frequencies give an overall picture, but the exact numbers can shift slightly each time due to the nature of LLMs."
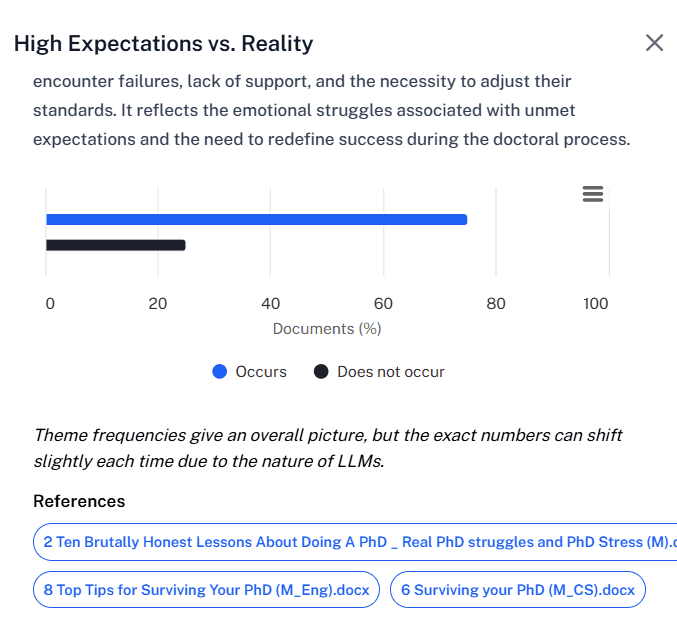
Figure 3: QInsights screenshot of a theme description
This transparency is intentional. We're not pretending the AI has discovered objective truth—we're showing you what patterns it detected in this particular run, so you can decide what to do with them.
Step 2: Select Which Themes to Explore Further
This is where the human researcher's judgment becomes central. Not all patterns deserve equal attention. Some are central to your research questions. Others are marginal. Some might be artifacts of how people phrase things rather than meaningful distinctions.
You decide which themes warrant deeper exploration. When you select a theme, QInsights helps you move beyond the surface-level grouping into genuine interpretation:
Summarize how the pattern is expressed across different responses—What language do people use? What framing appears repeatedly?
Highlight variation within the pattern—Are there subgroups or different ways this theme shows up?
Show typical vs. deviant expressions—What's the mainstream version of this pattern, and where does it diverge?
This is where AI provides heavy lifting without pretending to decide meaning. It can pull together dozens or hundreds of responses and help you see patterns you might miss manually—but you're the one interpreting what those patterns mean.
Step 3: LLMs Support Interpretation (Not Counting)
As you work through themes, you might want to understand how they relate to each other or to different segments of your respondents. This is where QInsights enables you to ask interpretive questions rather than just quantitative ones:
What are the most relevant similarities across groups?
What differences emerge between subgroups?
What are the unique responses that don't fit the main patterns?
The AI retrieves and organizes relevant responses to help you think through these questions—but it doesn't replace your analytical judgment with automated answers.
Step 4: Cross-Tabs Without Statistical Illusion
One of the most common requests in research is: "How do these patterns differ across groups?" It's a legitimate question—but the typical approach (exporting to SPSS and running ANOVAs) is methodologically inappropriate for most qualitative data.
QInsights offers something different: pattern lenses instead of significance tests.
Example question: "How does this pattern show up across age groups?"
Instead of outputting a table with percentages and p-values, QInsights retrieves and contrasts actual expressions of the pattern across groups. You get:
Short comparative summaries for each subgroup (What does this theme look like among younger vs. older respondents?)
Key quotes from each group that illustrate the pattern
Optional rough prevalence indicators (Does this appear frequently in one group and rarely in another?)
But sometimes you need to see the bigger picture at a glance. This is where QInsights' structured overview tables become invaluable. You can prompt the AI to create a matrix that shows how themes or perspectives appear across your respondents or subgroups—similar to the "matrix analysis" researchers used to do manually, but at scale.
For instance, you might ask: "Create a table with respondent demographics in the columns across the top, and perspectives on [Topic X] in the rows. In the cells, indicate with an X if the topic was mentioned, include a supporting quote if applicable, and specify the sentiment expressed."
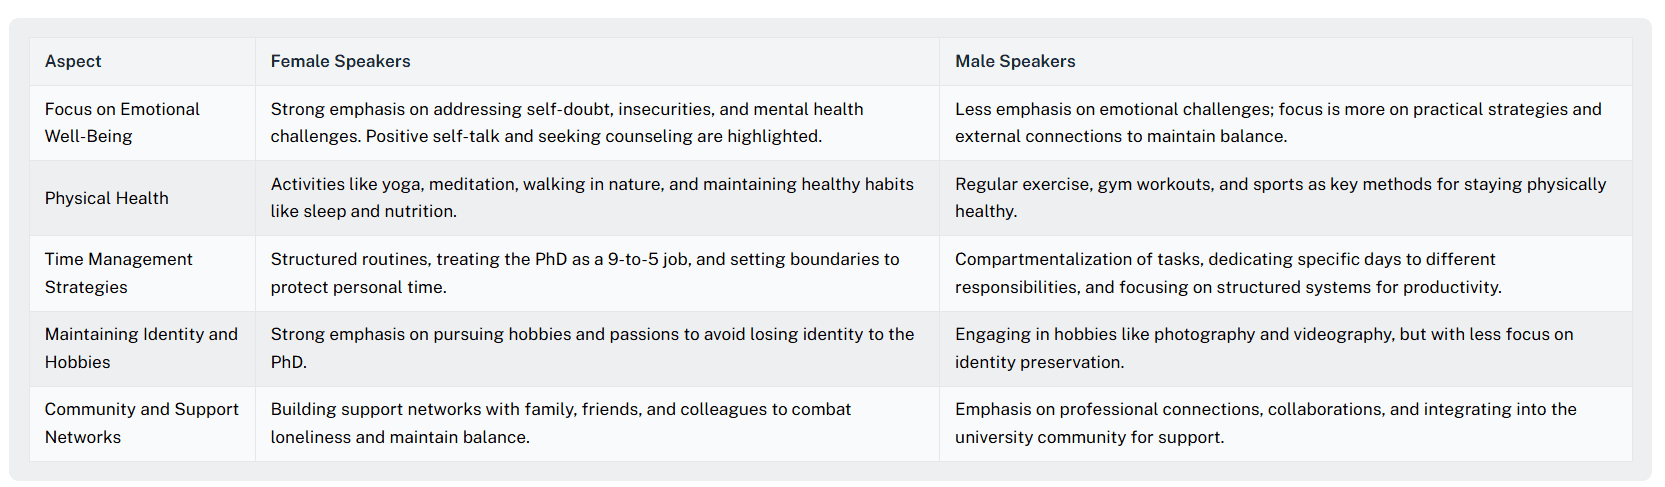
Figure 4: QInsights screenshot of a comparison table in conversational analysis
What you get is a side-by-side comparison that lets you scan patterns across your entire dataset while maintaining direct connection to the evidence. You can see at a glance which perspectives appear across different groups, which are concentrated in specific segments, and which deviate from the norm—all while having immediate access to supporting quotes.
This keeps interpretation front and center rather than hiding behind statistical procedures that obscure what people actually said. You're comparing meanings and expressions, not just counting occurrences.
Why QInsights Won't Chase the "Instant Analysis" Market
We could build these features. Technically, it wouldn't be difficult. But we won't—because we care more about research integrity than marketing appeal.
The researchers and organizations we want to work with are the ones who:
Understand that speed and rigor sometimes trade off
Value transparency over the appearance of scientific precision
Want tools that support their judgment rather than replace it
Recognize that "AI-powered" doesn't automatically mean "valid"
Our Positioning
QInsights surfaces patterns and variations at scale—without turning probabilistic AI output into fake numbers.
This isn't just a tagline. It reflects fundamental choices we've made about what kind of research tool we want to build and what kind of research community we want to serve.
We believe that AI can do powerful pattern-spotting work. It can process volumes of text that would take humans weeks to read systematically. It can identify semantic similarities that might not be obvious at first glance. It can help surface themes and variations that deserve attention. These are genuine capabilities worth leveraging.
But we also believe that humans need to remain in the interpretive loop. The move from "here's what people said" to "here's what it means" requires judgment, context, and critical thinking that AI cannot replicate. Researchers aren't bottlenecks to be eliminated—they're the source of analytical insight. Our job is to support that work, not replace it.
This is why transparency about limitations is a feature, not a weakness. When we tell you that theme frequencies can shift slightly between runs because of how LLMs work, we're not apologizing for a bug—we're being honest about the technology. When we call something a "pattern candidate" instead of a "validated theme," we're acknowledging that you still have analytical work to do. This honesty builds trust and promotes better research.
Above all, we believe that good research takes thought, not just automation. If you're looking for one-click answers, we're probably not the right tool for you.
If you're looking for scalable sensemaking with methodological integrity, let's talk.
The Bigger Picture: AI Literacy in Research
This isn't just about one category of tools or one methodological debate. It's about a broader responsibility that researchers, tool builders, and research organizations share: We need to build AI literacy alongside AI capabilities. That means:
Understanding what AI can and cannot do
Questioning claims that sound too good to be true
Recognizing the difference between efficiency and rigor
Teaching the next generation of researchers to think critically about AI
The tools that promise instant, objective, scientifically rigorous analysis through automation aren't just methodologically weak—they're actively harmful. They undermine research integrity, erode trust in qualitative methods, create a race to the bottom where speed matters more than rigor, train researchers to outsource judgment rather than develop it.
QInsights exists as an alternative to this vision.
We're building a tool that enhance human analytical capacity rather than replace it
Make AI's role and limitations transparent
Scale thoughtfully without sacrificing integrity
Treat researchers as skilled professionals, not automation consumers
Where to Learn More
If this resonates with you—if you're looking for tools that respect both the power of AI and the necessity of human judgment—we'd love to hear from you.
We're actively developing features that embody these principles. If you'd like to be part of shaping what rigorous, scalable, AI-supported research looks like, get in touch.
Because good research can't be automated—but it can be supported.
Interested in discussing these ideas further? Have questions about how QInsights approaches AI in research? Contact us: hello@qinsights.ai, or join our next webinar.
